The preparation of rubber compound is influenced by several factors that affect the results obtained:
All of these factors can have an effect on the characteristics of the compound produced. In many cases the variations are small and don’t have a significant effect on the results obtained after vulcanisation. However, compound producers statistically produce between 1% and 5% of non-conforming compounds that require additional rework activity to correct the defects. Mitigating this is clearly a priority for everyone in the supply chain.
One of the biggest differences between rubber and other products is that mistakes in the compound (Dispersion problems or mistakes in the quantity of accelerators) can be invisible during the mixing and calendaring process and are only identified when the final product is manufactured.
Normally a test of the compound is made with a Rheometer to identify any of the possible problems in a rubber compound mix. The test takes a few minutes (generally between 3 and 5) and is normally done on 100% of the batches.
The Rheometer enables us to measure the change in the properties of a rubber compound during the process of vulcanization. It is used to apply a cyclic strain to a test piece and the associated force is measured. The test is carried out at a predetermined constant temperature and the measure of stiffness is recorded continuously as a function of time.

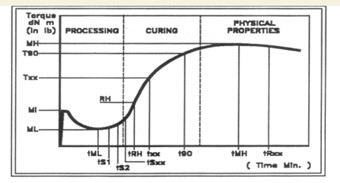
Figure 1 Results Obtained with a Rheometer
The Processing Phase
During which the viscous (plastic) behaviour of the compound shows the rubbers processability and therefore provides indications about the fluidity in the moulds.
Meaningful results are: ML, (least torque) tS1, tS2: Scorch time: time required for the increase of 1 (ts1) or 2 (ts2) points from Minimum Torque. This number is an indication of the time required for the start of the process of cross linking.
The Curing Phase
During the curing phase of the curve, the cross-linking process evolves.
Typical data that can be obtained from the curve are:
t’10: time corresponding to 10% curing
t’50: time corresponding to 50% curing
t’90: time corresponding to 90% curing.
This result is considered the ’optimum vulcanization time’
Physical Properties
The last part of the curve is an indication of the physical proprieties of the compound. The maximum value of torque obtained is related to:
The typical result is: MH: Maximum Torque
After the Maximum Torque has been reached the degradation of the compound can be measured, the slope of the curve is an indication of the resistance of the compound at high temperature and can be useful for the design of the transformation process
· TR_x: Time for the torque reduction of x points
In most cases the Rheometer curve obtained during curing will be overlaid against a library copy of a previous mix that is known to meet the physical requirements of the formulation. If the test Rheometer curve is within +/- 1% of the library version it is determined that the material is within tolerance and any full cured material will perform in accordance with the technical standard.

Figure 2 Screen Shot of a Rheometer Screen
For technical support on our high quality materials, batch testing or material applications please contact your account manager or our sales office.
2024
2023
2022
2021
2020
2019
2018
2017
2016
2015
2014
2013
2012
|
|
|